Visualizing data with Angular and D3


Created by Victor Powell / @vicapow

# About me
# I visualize data
[![](img/monsoonco-logo-black-bg.png)](http://www.monsoonco.com/‎)
![](img/hp-spog-1.png)
# I teach
![](img/hackreactor-logo-white-bg.png)
# I like to explain things
![](img/central-limit-theorem.png)
![](img/monty-hall.png)
![](img/simpsons-paradox.png)
# I'm writing a book
![](img/d3-on-angular.png)

Need help understanding your data?

lets talk: me@vctr.me
![](img/hello-kitty.png) ok.. no more ads
__Why__ and __how__ should you use angular with D3 for doing data visualization?
Why you should care about data visualization
Anscombe's quartet
I II III IV
x y x y x y x y
10.0 8.04 10.0 9.14 10.0 7.46 8.0 6.58
8.0 6.95 8.0 8.14 8.0 6.77 8.0 5.76
13.0 7.58 13.0 8.74 13.0 12.74 8.0 7.71
9.0 8.81 9.0 8.77 9.0 7.11 8.0 8.84
11.0 8.33 11.0 9.26 11.0 7.81 8.0 8.47
14.0 9.96 14.0 8.10 14.0 8.84 8.0 7.04
6.0 7.24 6.0 6.13 6.0 6.08 8.0 5.25
4.0 4.26 4.0 3.10 4.0 5.39 19.0 12.50
12.0 10.84 12.0 9.13 12.0 8.15 8.0 5.56
7.0 4.82 7.0 7.26 7.0 6.42 8.0 7.91
5.0 5.68 5.0 4.74 5.0 5.73 8.0 6.89
Summary statistics
mean of x 9
variance of x 11
mean of y 7.50
variance of y 4.12
correlation of x and y 0.816
linear regression y = 3.0 + 0.5 * x
[![](img/anscombes_quartet.svg)](http://en.wikipedia.org/wiki/Anscombe's_quartet)
Why you should use Angular for data visualization
# Directives
think of `<input>` fields as directives
````html <input type="range" min="1" max="100" value="0"> ````
````html <input type="date" value="1989-01-23"> ````
````html <donut-chart></donut-chart> ````
![](img/donut-chart-1.png)
conditional templates (via `ng-switch`)
````html <div ng-switch on="selection"> <div ng-switch-when="pie"> <pie-chart></pie-chart> </div> <div ng-switch-default> <bar-chart></bar-chart> </div> </div> ````
# Small multiples (via `ng-repeat`)
![](img/the-horse-in-motion.jpg)
![](img/the-horse-in-motion.gif)
[![](img/andrew-gelman-school-vouchers-map.png)](http://andrewgelman.com/2009/07/15/hard_sell_for_b/)
````html <donut-chart ng-repeat="chart in charts"></donut-chart> ````
![](img/small-multiples-with-ng-repeat.png)
````html <div ng-repeat="races in incomes"> <map ng-repeat="race in races"></map> </div> ````
Yo dawge...
[demo](demos/life-expectancy/index.html)
## Responsive Design [demo](demos/responsive/index.html)
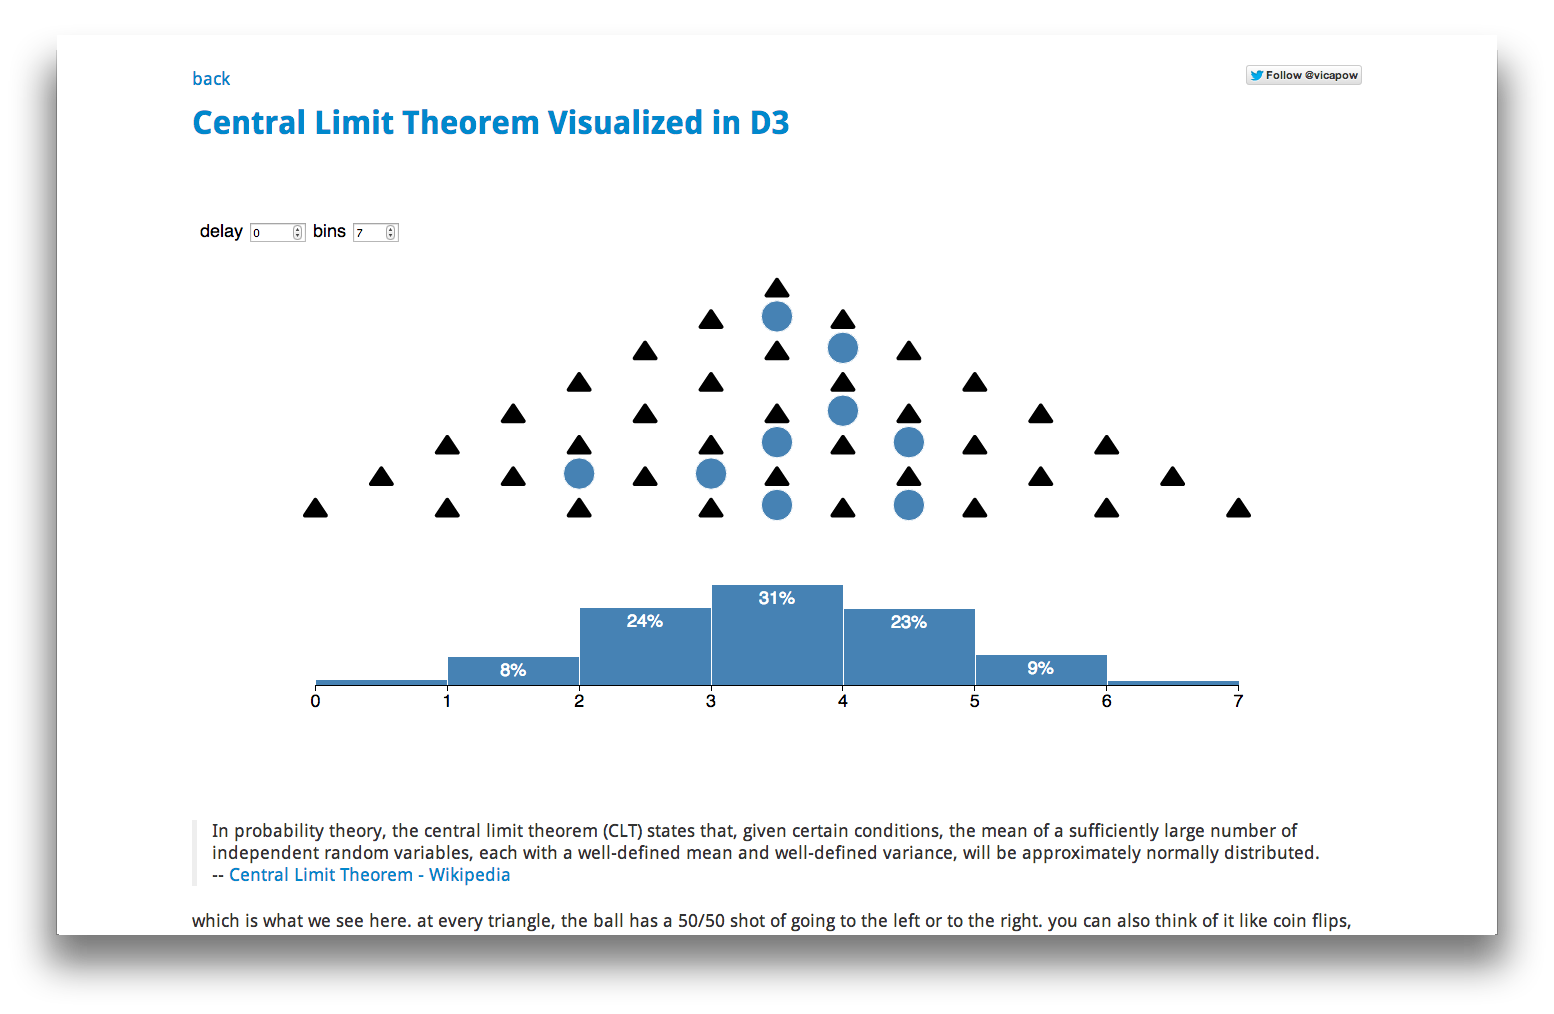
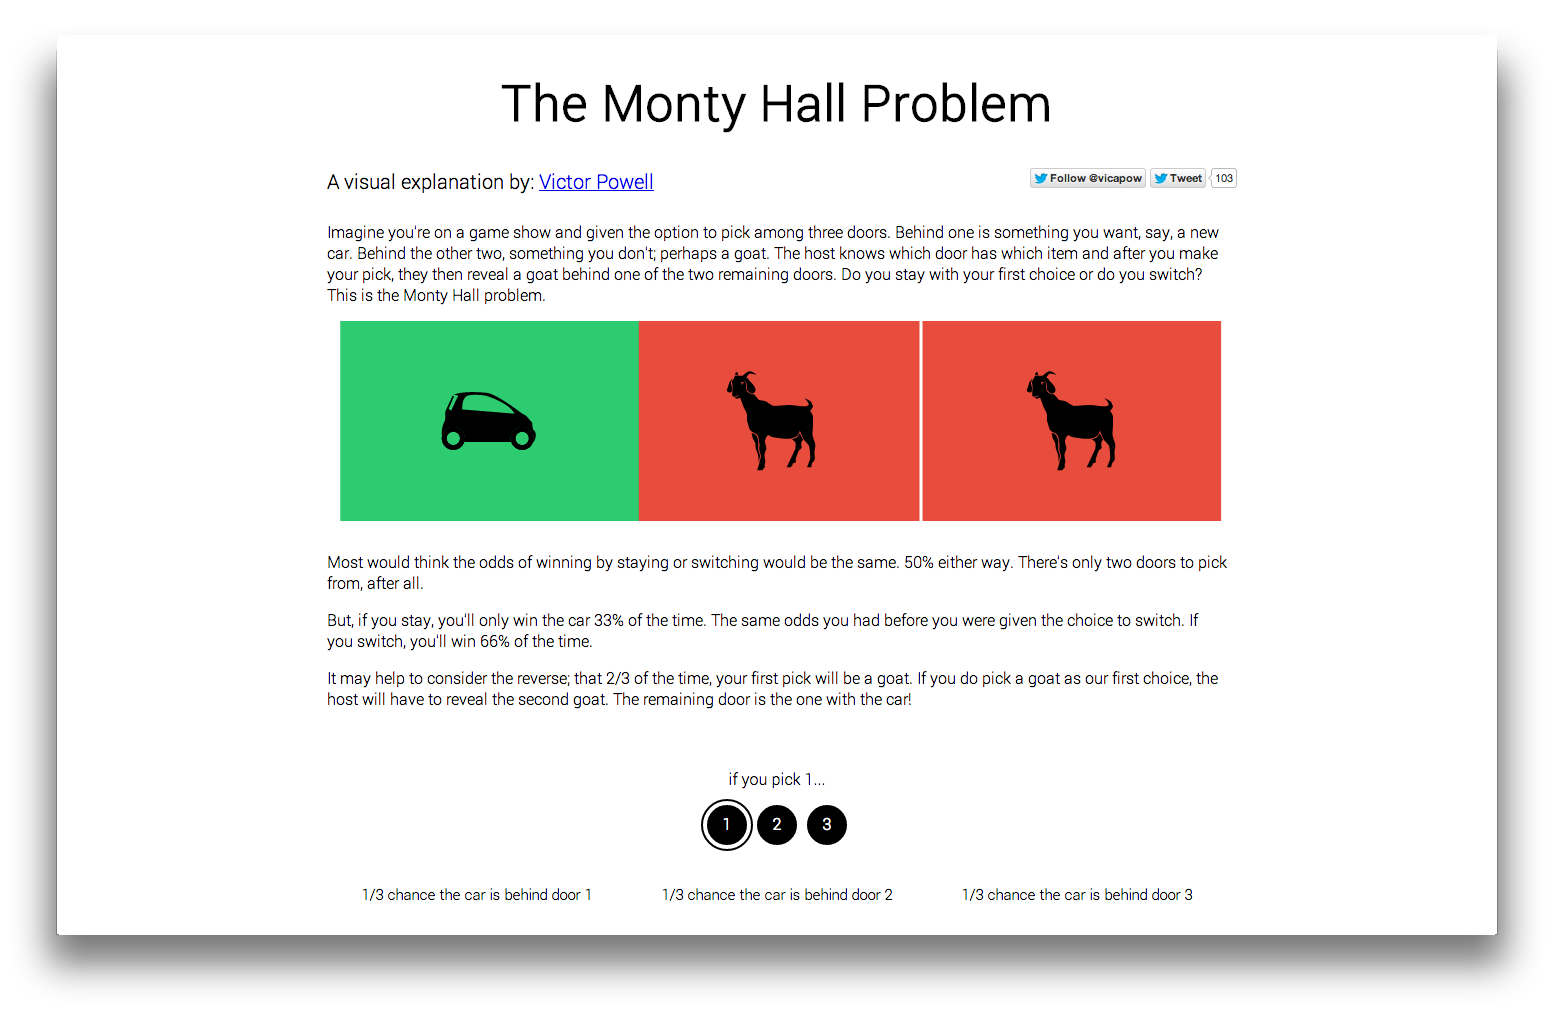
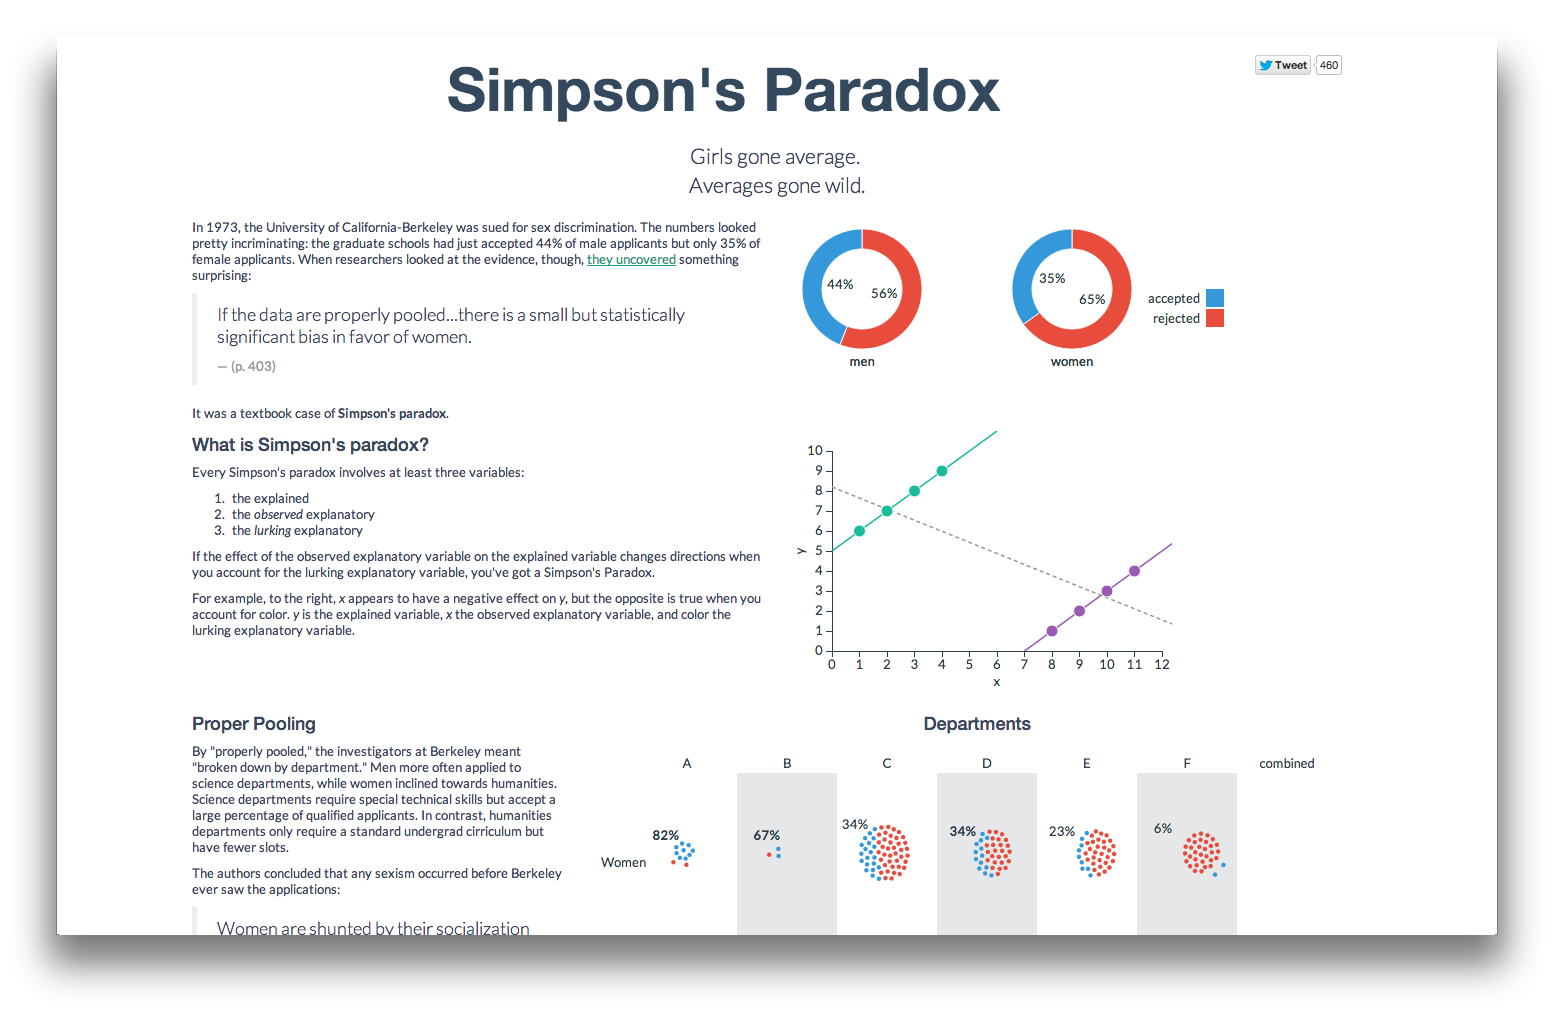
# Interactivity across visualizations [Demo 1](http://vudlab.com/simpsons/) [Demo 2](demos/AI-editor/index.html)
# __How__ to make a donut chart directive
## What we'll build [demo](demos/lets-make-a-donut-chart-directive/v9-using-a-controller-and-seperating-out-business-logic.html)
# An (extremely) brief intro to [D3](http://d3js.org)

D

ata


D

riven


D

ocuments


# D3
D3(data) -> DOM
for example
Data ````javascript // somehow you get data var data = [20, 50, 80]; ```` D3 ````javascript d3.select('body').selectAll('div').data(data) .enter().append('div') // set the width based on the current data item .style('width', function(d){ return d + '%' }); ````
DOM ````html <!DOCTYPE html> <html> <div style="width:20%;"></div> <div style="width:50%;"></div> <div style="width:80%;"></div> </html> ````
[demo](demos/d3-intro/div-bar-chart.html)
# Layouts
# d3.layout.pie()
data

              var data = [35, 28, 73];
            
pie layout

              var pie = d3.layout.pie();
            
````javascript pie([35, 28, 72]); // result --> [ { startAngle:3.37, endAngle:4.99, data:35, value:35 }, { startAngle:4.99, endAngle:6.28, data:28, value:28 }, { startAngle:0, endAngle:3.37, data:73, value:73 } ] ````
````javascript // a function that takes a pie layout item and produces a // new arc shaped <path> tag. var arc = d3.svg.arc().innerRadius(400).outerRadius(600); // create the arcs, passing each data element of the // pie layout to the `arc` generator function. d3.select('svg').selectAll('path').data(pie(data)) .enter().append('path') .attr('d', arc); ````
````css path{ stroke-width: 10; stroke: white; } ````
[demo](demos/lets-make-a-donut-chart-directive/v0.1-d3-layout.pie.html)
````javascript d3.select('svg').append('g') // nudge the content in the svg down and to the right .attr('transform', 'translate(300, 300)') .selectAll('path').data(pie(data)) .enter().append('path') .attr('d', arc); ````
[demo](demos/lets-make-a-donut-chart-directive/v0.2-d3-layout.pie.html)
# Additional Resources
### [An SVG Primer](http://alignedleft.com/tutorials/d3/an-svg-primer) by Scott Murray
### [Let's Make a Bar Chart](http://bost.ocks.org/mike/bar/) intro to D3 by Mike Bostock
### [Thinking with Joins](http://bost.ocks.org/mike/join/) also by Mike Bostock explains this black magic: ````javascript d3.select('svg').append('g') .selectAll('path').data(pie(data)) .enter().append('path') .attr('d', arc); ````
# Directives
````javascript var app = angular.module('myApp', []); app.directive('donutChart', function() { return { restrict: 'E', link: function(scope, element) { // D3 bits... } }; }); ````
The D3 bits ````javascript var width = 500, height = 500; var color = d3.scale.category10(); var pie = d3.layout.pie().sort(null); var arc = d3.svg.arc() .outerRadius(width / 2 * 0.9) .innerRadius(width / 2 * 0.5); var svg = d3.select(element[0]).append('svg') .attr({width: width, height: height}) .append('g') .attr('transform', 'translate(' + width / 2 + ',' + height / 2 + ')'); // add the <path>s for each arc slice svg.selectAll('path').data(pie([82, 62, 10, 32])) .enter().append('path') .style('stroke', 'white') .attr('d', arc) .attr('fill', function(d, i){ return color(i) }); ````

  <body ng-app="myApp">
    <donut-chart></donut-chart>
  </body>
              
[demo](demos/lets-make-a-donut-chart-directive/v0.5-directive.html)

  <body ng-app="myApp">
    <donut-chart></donut-chart>
    <donut-chart></donut-chart>
    <donut-chart></donut-chart>
  </body>
              
[demo](demos/lets-make-a-donut-chart-directive/v0.5.1-directive.html)
but new donut charts will all have the same data...
# Data binding via the scope
````html <body ng-app="myApp" ng-init="data=[82, 62, 10, 32]"> <donut-chart></donut-chart> </body> ````
````javascript var app = angular.module('myApp', []); app.directive('donutChart', function() { return { restrict: 'E', link: function(scope, element) { // use the `data` scope property var data = scope.data; // carry on... } }; }); ````
````html <body ng-app="myApp" ng-init="data=[82, 62, 10, 32]"> <donut-chart></donut-chart> <donut-chart></donut-chart> <donut-chart></donut-chart> </body> ```` [demo](demos/lets-make-a-donut-chart-directive/v0.5.2-directive.html)
# Isolate scope
````javascript var app = angular.module('myApp', []); app.directive('donutChart', function() { return { restrict: 'E', scope: { data: '=' } // isolate scope link: function(scope, element) { var data = scope.data; // the D3 bits... }}; }); ````

  <body ng-app="myApp" ng-init="data=[82, 62, 10, 32]">
    <donut-chart data="data"></donut-chart>
  </body>
              

  <body ng-app="myApp" ng-init="heights=[82, 62, 10, 32]">
    <donut-chart data="heights"></donut-chart>
  </body>
              
````html <body ng-app="myApp" ng-init="whatever=[82, 62, 10, 32]"> <donut-chart data="whatever"></donut-chart> </body> ````
````html <body ng-app="myApp"> <donut-chart data="[10, 10]"></donut-chart> <donut-chart data="[10, 10, 20]"></donut-chart> </body> ```` [demo](demos/lets-make-a-donut-chart-directive/v1.1-directive.html)
# Great
# Sharing data

  <body ng-app="myApp" ng-init="myData=[82, 62, 10, 32]">
    <donut-chart data="myData"></donut-chart>
    <donut-chart data="myData"></donut-chart>
  </body>
              
demo
# ng-repeat (aka, small multiples)
````html <body ng-app="myApp" ng-init="charts=[[5, 3], [1, 2], [2, 2]]"> <donut-chart data="data" ng-repeat="data in charts"></donut-chart> </body> ```` [demo](demos/lets-make-a-donut-chart-directive/v2.1-sharing-data.html)
but what if our data changes?
there's nothing you can do.
jk
# $watch # and # $apply
`$watch` for changes
````javascript svg.on('mousedown', function(d) { // change the data data = d3.range(4).map(Math.random); // update the arc <path> tags arcs.data(pie(data)).attr('d', arc); }); ```` [demo](demos/lets-make-a-donut-chart-directive/v3-updating-data.html)

  <body ng-app="myApp">
    <div ng-init="chartData=[82, 82, 10, 32]">
      <donut-chart data="chartData"></donut-chart>
      <donut-chart data="chartData"></donut-chart>
    </div>
  </body>
              
demo
Wait, [WAT?](https://www.destroyallsoftware.com/talks/wat)
Angular doesn't know the scope changed.
how does it know?!
````javascript var $timeout = function(callback, delay){ setTimeout(function(){ // after the callback, check all the scopes for changes $scope.apply(function(){ callback(); }); }, delay); } ````
it usually knows automatically via: + `ng-mouseover` + `ng-click` + `$timeout` + `$http` + etc...
````javascript svg.on('mousedown', function(d) { scope.$apply(function(){ // now inside angular world. safely update the data scope.data = d3.range(4).map(Math.random); }); }); scope.$watch('data', function(data) { // `data` changed! update the arc <path>s arcs.data(pie(data)).attr('d', arc); }); ```` [demo](demos/lets-make-a-donut-chart-directive/v4-updating-shared-data-with-watch-and-apply.html)
sweet
rrr.. wait a sec.. now ng-repeat don't work...

  <body ng-app="myApp">
    <div ng-init="data=[1, 4, 2, 5]">
      <donut-chart data="data" ng-repeat="item in [1, 2, 3]">
      </donut-chart>
    </div>
  </body>
              
demo
`ng-repeat` items each get a new scope. [(more on object inheritance)](https://developer.mozilla.org/en-US/docs/Web/JavaScript/Introduction_to_Object-Oriented_JavaScript#Inheritance)
```` <body ng-app="myApp"> <div ng-init="shared = { data: [1, 4, 2, 5] }"> <donut-chart data="shared.data" ng-repeat="item in [1, 2, 3]"> </donut-chart> </div> </body> ```` [demo](demos/lets-make-a-donut-chart-directive/v6-ng-repeat-and-scope-inheritance-part2.html)
awesome
rrrr... wait.. what about animation?
# Transitions
````javascript // our data changed! update the arcs scope.$watch('data', function(data){ arcs.data(pie(data)).transition().attrTween('d', arcTween); }); // transition the arc angles function arcTween(a) { // see: http://bl.ocks.org/mbostock/1346410 var i = d3.interpolate(this._current, a); this._current = i(0); return function(t) { return arc(i(t)); }; } ````
[transitioning arc angles demo](demos/arch-angels/index.html)
whoops... lets try that again. [transitioning arc angles demo](demos/lets-make-a-donut-chart-directive/v7-animation.html)
okay, but things break if the length of our data doesn't remain the same. now what?
# `.enter()` # & # `.exit()`
````javascript scope.$watch('data', function(newData, oldData){ // 1.) animate the arcs that stayed around // 2.) add and animate any new arcs (if newData.length > oldData.length) // 3.) or remove any old arcs (if newData.length < oldData.length ) }); ```` [demo](demos/lets-make-a-donut-chart-directive/v8-enter-and-exit.html)
But wait! Our directive is _still_ modifying our data directly. That doesn't sound __modular__...
you're right, it's not
# Separating out behavior
````html <donut-chart data="chartData" on-click="doSomething()"></donut-chart> ````
````javascript scope: { 'data': '=', 'onClick': '&' } ```` ````javascript // inside of `link` svg.on('mousedown', function(d) { scope.$apply(function(){ if(scope.onClick) scope.onClick(); }); }); ```` [demo](demos/lets-make-a-donut-chart-directive/v9-using-a-controller-and-seperating-out-business-logic.html)
[a larger demo](demos/a-donut-chart-editor/index.html)
# Best practices
keep data / behavior (click handlers) out of the directive
(pass these in through the scope)
````html <donut-chart on-click="chartClicked()"></donut-chart> ````
````javascript svg.on('mousedown', function(d) { scope.$apply(function(){ if(scope.onClick) scope.onClick(); }); }); ````
pass accessor functions through the scope to the directive
````javascript app.controller('MainCtrl', function($scope){ $scope.myAccessor = function(d){ return d.value }; $scope.myData = [ { value: 82 }, { value: 12 }, { value: 42 }, { value: 63 } ]; }); ````
````html <div ng-controller="MainCtrl"> <bar-chart accessor="myAccessor" data="myData"></bar-chart> </div> ````
make your directives responsive by watching `clientWidth` and `clientHeight` [demo](demos/responsive/index.html)
````javascript scope.$watch(function(){ return el.clientWidth * el.clientHeight }, function(){ width = el.clientWidth; height = el.clientHeight; resize(); }); ````
````css bar-chart{ width: 100%; height: 100%; display: block; overflow: hidden; } ````
load data from services
````javascript app.controller('MainCtrl', function($pricingService){ $pricingService.getDay('2014-01-23', function(data){ scope.data = data; }); }); ````
# FIN
# Q & A